Announcing the launch of Utopia, the suite of apps within Opus 23 that analyzes and reports on sequential data from uBiome tests. uBiome is the world’s first sequencing-based clinical microbiome screening test, giving the user insight into the bacterial population of multiple body areas. Utopia recognizes all bacteria found by uBiome, but is specifically interested in the gut bacteria and its interaction with the client’s own genomic DNA. Utopia is free for existing clients: Once you have uploaded 23andMe raw data for your client, you can add as many uBiome tests as you want for that client without additional charge. Utopia will then give you access to multiple apps to analyze the data and reference it to the client’s genomic data where appropriate.
![]()
LOAM: Adaptable taxon data
LOAM is a highly flexible search and sort tool that allows you to easily navigate through your client’s Ubiome results by taxon. LOAM allows you to filter taxonomic data based upon several useful parameters as well as sort the filtered results. It is similar to the ARGONAUT app in Opus 23.
![]()
Navigating LOAM
From the Utopia drop down menu, hover over ‘analytics’ until a second list appears, then select LOAM. You will then be presented with the default table which shows ‘everything’ and is sorted by ‘repute’ or ‘interpretation’.
At the bottom of the window is a jump screen that allows you to move from one screen to the next. You can control how many rows to display be selecting an option from the ‘Show’ pull down menu. The default is 15.
Filtering and sorting results
LOAM allows you to parse the taxon data based upon desired treatment goals. Taxons are sortable by benefit as well as pathogenic potential.
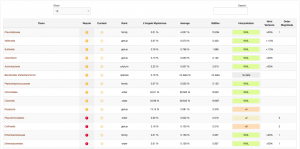
The LOAM table displays the following data by column:
- Taxon name
- Repute, displaying beneficial !, neutral ! and pathogenic !
- Rank
- Client-specific % population
- Average % (if available)
- Standard deviation (if available)
- Interpretation (displayed up to +6 times the standard deviation, populations found in a greater abundance are indicated by ∞)
- Normal variance
- Order magnitude
Click on any desired taxon to open up its information pop—up window for detailed information including taxonomy, an overview of known disease or health benefit associations, interactions and metabolomics. Click ‘add/ curate’ to include it in your clients report. The Curated column will then show a green checkmark against all curated taxon after refreshing the page.
LOAM columns are sortable. Click on any column title to sort by that column. Click that column again to reverse the sort order.