The Agency app in Opus 23 takes pharmacogenomics to the next level. Relying on the extensive Opus 23 database of published research detailing gene expression data linked to natural products, Agency provides a visual representation of their interactions web. Multiple agents can be displayed, allowing the clinician to synthesis multi-target strategies.
In the image above we see the expression pattern for co-enzyme Q10, a powerful anti-oxidant. Co-enzyme Q10 (COQ10) is the light green node in the center. The tan nodes surrounding it are the genes that interact with COQ10: Red edges (connecting lines) with a ‘T-bar’ indicate that COQ10 inhibits the expression of that gene. Green edges with an arrow indicate that COQ10 enhances the expression of that gene. Genes with a reddish color indicate that they may have compromised function in the current active client in Opus 23. Other agents with especially high abilities to influence the expression of any genes associated with COQ10 are at the periphery of the map and colored gray.
A few examples that can be gleaned from the map:
- The ability of COQ10 to increase superoxide dismutase (SOD1) might be enhanced by concurrent administration of Silymarin and Pycnogenol
- The ability of COQ10 to antagonize interleukin 6 (IL6) might be enhanced by concurrent administration of omega 3 fatty acids
- The effect of COQ10 to antagonize vascular endothelial growth factor A (VEGFA) might be enhanced by concurrent administration of wogonin (Scutellaria biacalensis), honokiol (Magnolia officinalis) and matrine (Sophora flavenscens). Notice that this gene is compromised in the current client.
Like virtually every data depiction in Opus 23, clicking on any node brings up the information popup for that entity: clicking on an agent node brings up its expression data (with links to PubMed citations) while clickin on any gene brings up its genomic data any relevant SNP data associated with that gene.
In addition to its network (web) depiction, any natural product can have its gene expression data depicted as a polar chart.
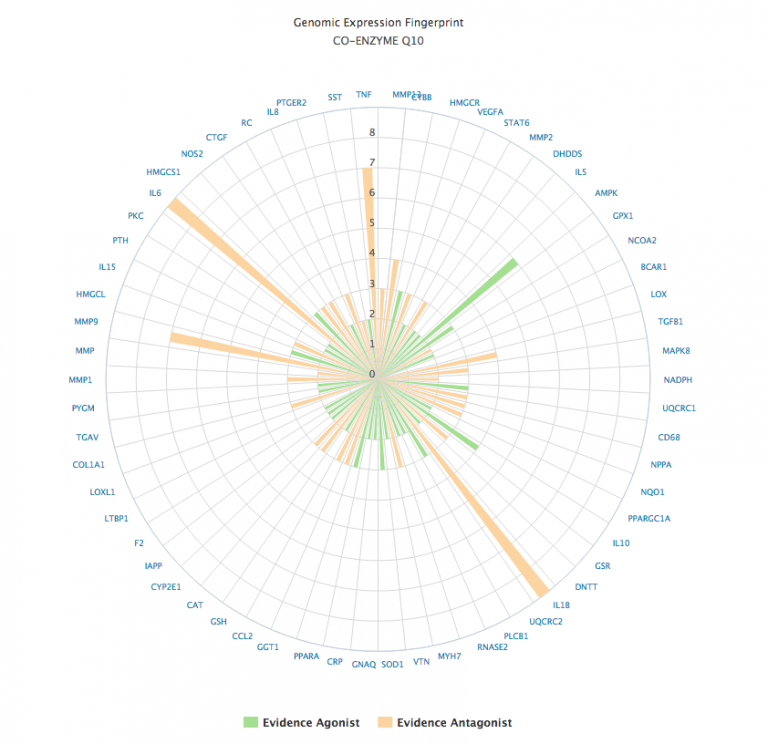
The polar chart format display the gene expression data as orange if the evidence is suggestive of an antagonistic effect, or green if the effect is agonistic. The strength of the evidence is computed from the sum total of the evidence, scaled by the type of experimental subject (in vitro, animal or human study).